
January Valuation update
22% expected portfolio IRR with a 3% shareholder yield

In order to stay up to date with my portfolio and the opportunities within, I update my valuation spreadsheet monthly.
In this post, we’ll look at
the IRR distribution + Quality matrix + risk score for all my holdings.
the downgrading of one core conviction.
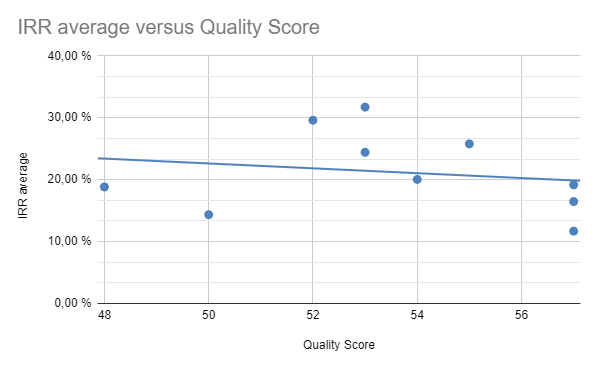
Right now, the weighted average company has a quality score of 53.6, with one outlier under 50. Currently there are no candidates for a sale and I see most of the companies as attractive opportunities. Overall, the weighted average IRR expectation is 22% throughout my portfolio, with a range between 11.6-31.7% and a 3% shareholder yield (buybacks + dividends).
While most of my companies performed poorly in recent months, driven by multiple rerating, they are now even more compelling. I concentrated my portfolio into those opportunities that stand out against my investable universe and watchlist. In the matrix below we can see that generally my highest quality companies have the lowest expected return, but a quality score of 54 on average still beats out most companies on my watchlist. If my assumptions about valuation are just directionally right, I should be set up to handily beat my target of 15% annually going forward with a good margin of safety.
Next I’ll share my valuation matrix, which includes quality score, IRR range, fundamental IRR range (fundamental return drivers without exit multiple), portfolio weight, cost base and shareholder yield. I sort this matrix:
by quality score to emphasize the highest quality companies
by average IRR to emphasize the overall best risk reward
by combined ratio, which multiplies the difference between average quality score and the individual company with the expected IRR.
My personal hurdle rate to buy shares is a 15-20% IRR depending on the quality. I prefer to buy the higher quality names in my portfolio, but the quality score is not a definite truth. I also added three quality buckets to group companies. Furthermore, I adjust my hurdle rates based on these tiers:
Outstanding Quality (3 companies): 15% hurdle rate
Great Quality (6 companies): 17.5% hurdle rate
Good Quality (1 companies): 20% hurdle rate
Below is a list of my portfolio, ranked by quality score. You’ll notice that my bucket tiers do not necessarily correlated with the quality score. To get into the outstanding bucket, I need an even higher conviction about the moat and management team of a business, which is very tough to rank in the score.