


The Hidden Risk of Historical Valuation Multiples
Understand why past valuation multiples often lead to bad decisions—and what to do instead.

As investors, we love a good shortcut. And one of the most common? Looking at historical valuation multiples to decide if a stock is cheap, fairly valued, or expensive.
But here’s the problem: relying on historical P/E ratios, EV/EBIT, or other multiples can be dangerous if we don’t understand the context behind them.
Past multiples often reflect a different reality.
A business trading at a 20x P/E five years ago might have had slower growth, lower margins or more risk. Today, it could be a much better company—with stronger fundamentals—deserving of a higher multiple. Or the opposite: what looks cheap on a historical basis could reflect new structural risks the market is now pricing in. Later, we’ll look at a free example of a popular stock where valuations declined for all the right reasons—and a paid example (>20% expected IRR) where the market pays a lower multiple without justification.

What Can Go Wrong?
1. Business Quality Changes Over Time
Improved or worsened competitive position
Better (or worse) capital allocation
Structural industry shifts
Key changes in the management team
Strategic pivots, i.e., transition from software licenses to a recurring SaaS model
Historical multiples often reflect yesterday’s business, not today’s.
2. Interest Rates and Discount Rates Matter
A 20x multiple in a 0% interest rate world is not the same as a 20x multiple when rates are 5%. Market dynamics change valuation norms. It’s a good idea to look at the difference between the risk-free rate (government bonds payout) and the earnings yield (inverse of a multiple).
Investing is a game of opportunity costs: we must be compensated for the risk of owning businesses with growth or yield!
3. Cyclical Peaks and Troughs Distort Multiples
Earnings are volatile in cyclical industries. A low multiple ratio may reflect peak earnings and hide downside risk. Peter Lynch advised to buy cyclicals when it looks ugly. This often coincides with HIGH earnings multiples, as share price falls significantly and earnings collapse.
4. Accounting Changes
Sometimes accounting standards change (think: lease capitalization, intangibles), which can distort comparability over time. An example from my own portfolio was Adyen switching from gross to net revenue calculations in its business. This means that they only counted fees as revenue, leading to reported revenue falling 90% without any impact to the business.
5. Growth Expectations Shift
Multiples are an approximation of expectations. If the market sees slowing growth ahead, a low multiple isn’t always a bargain—it may be a warning. With that being said, let’s look at the case of Ulta Beauty, a popular and polarizing specialty beauty retailer in the USA and a stock I used to own but sold out of at a nice gain in 2024.
💡 Want Better Investing Tools? Get Exclusive Discounts on What I Use!
I rely on fantastic tools to research and track investments—you can too, at a discount:
🔹 Koyfin – 20% off + 7-day free trial (my main research tool)
🔹 Finchat – 15% off (unique data visualization & KPIs)
🔹 Portseido – 20% off (portfolio tracking & return calculations)
🚀 Upgrade your toolkit today! [Click the links above]
Ulta Beauty (link to my deep dive)
Ulta Beauty is a popular and successful beauty retailer in the US. It offers added-value services like a hair salon in many of its locations and has a large cooperation with Target. Over the last year, many investors have been pounding the table on the great opportunity Ulta Beauty presents at these historically low multiples. Is that the case?
We can see that the PE of 14 (as of March 12th) is well below the 10-year median of 23.8; it’s similar for other metrics like EV/EBIT and FCF yield. Ulta suffers from 4/5 of the reasons laid out above:

1. Business Quality changed
This is a minor point, but there has been a significant increase in theft in the US since the pandemic and retailers are suffering from it. To combat the so-called inventory shrink, retailers are adding higher security measures like locking up high-value products or guards (in some cases even armed). This increases operating costs AND detracts from the customer experience. Especially in beauty, customers want to be in the store, try out products and have a good time.
2. Interest rates and discount rates
While Ulta has no debt, the company still enjoyed the benefits of a 0% risk-free comparable, which allowed its forward PE ratio to climb to 37 in 2021. Bonds are a real alternative now and suppress equity valuations, leading to Ulta’s multiple falling over 50% from peak valuations.
3. Cyclical Peaks and Troughs Distort Multiples
Ulta had peak margins in 2023 because, through the pandemic, a lot of operating improvements were made and with the reopening, they now also had the volume to show operating leverage. These inflated margins weren’t sustainable however and EBIT margin now is almost back to the median of 13%. Always be careful if margins rise strongly in a short period of time—be conservative.

5. Growth Expectations Shift
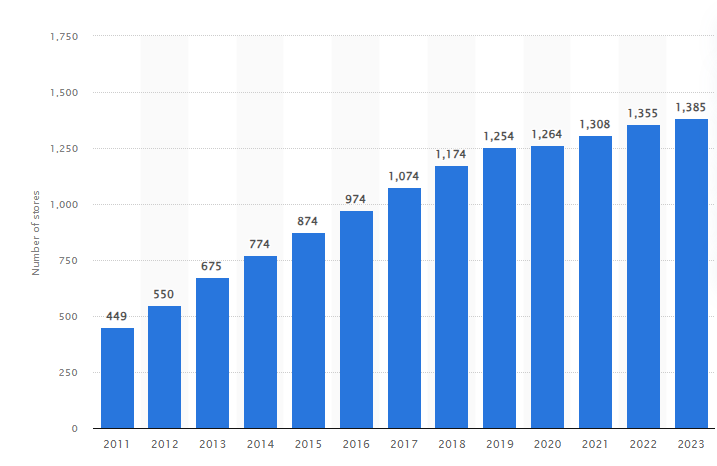
Over the last decade, Ulta grew revenues at a breakneck speed at an 18% CAGR. This was largely due to their massive investments in the store network, as seen in the chart below. In 2019 the store growth started to slow materially. Management now expects to reach the maturity of its store network, only expecting a few hundred more locations in the US. (The Mexico expansion is an opportunity, but also a big risk, in my opinion).
This materially changes the growth expectations and revenue growth keeps decelerating as a result. Ulta can’t be valued like a high-growth stock anymore, yet I still see people quoting their 10-year revenue CAGR as a reason to buy it.
Conclusion on Ulta
Ulta definitely deserves a lower multiple in its current form without significant growth drivers. Investors who continue to value them based on past multiples do not understand the full picture and will likely be disappointed. I can’t deny that it’s an interesting opportunity at these prices, though, just not for the same reasons and valuation methods many people think.
So, What Should We Do Instead?
Valuation should be forward-looking. Instead of anchoring on historical multiples, focus on:
Future free cash flow generation
Sustainable growth rates
Margins and competitive positioning
Capital allocation and reinvestment opportunities
Industry dynamics and secular trends
Historical multiples can inform your thinking, but they shouldn’t dictate your conclusions.
What’s Next?
In the premium section, I’ll show you:
✅ How I incorporate forward-looking valuations in my analysis
✅ A practical example from my portfolio: how different assumptions about growth, margins, and reinvestment rates can change what a “fair” multiple should be
✅ IRR model of a 20% IRR opportunity