


Free sample - Ashtead: Fundamentals and Valuation + United Rentals comparison
A long history of outsized returns by consolidating the US equipment rental industry via organic growth and bolt-on M&A

This is a free sample of the in-depth research I provide to my paid subscribers. My goal is to give you valuable insights into high-quality businesses while making investing easier and more rewarding.
If you find this deep dive useful, I’d love to welcome you as a premium subscriber—so you can access all my research, exclusive insights, and tools to invest smarter. Let’s grow and learn together!
Ashtead has been a big winner over the last decade, returning 16% for investors versus 10% for the S&P 500. We can see that most of this outperformance happened post-COVID and that Ashtead still trades below its 2021/22 peak. On the other hand, its larger rival, United Rentals, returned 20% and has vastly outperformed Ashtead over the last few years. Let’s review Ashtead’s fundamentals and why URI ran away since 2022. Check the first part here.


Ashtead has been a growth machine over the last decade, driven by its organic growth and bolt-on acquisition strategy. There are several reasons why they managed to generate these growth rates in a boring industry like equipment rentals:
A highly fragmented market where companies with <6 branches comprise 50% of all locations and low valuation multiples (6.1x EBITDA paid on average). Ashtead has acquired over 200 companies since 2011 with a ROIC of 15%, contributing 30% of NA revenues. The top 100 companies comprise just 56% of the market, leaving an abundance of acquisition targets.
Low interest rates certainly helped Ashtead because the company heavily relies on debt funding. From 2014 to today, total debt rose from $2 billion to $10.7 billion. However, earnings grew faster, and leverage is at an acceptable 2.2x net debt/EBITDA. Going forward, the company aims to reduce leverage to under 1x.
The overall market grew rapidly in North America, from $57 billion in 2018 to $77 billion in 2023 and estimated to reach $94 billion in 2027. This fueled growth above inflation levels for the existing branches before operational improvements and market share gains.

Ashtead versus United Rentals
Both companies have seen strong success over the last few years. EBIT growth rates have averaged around the same at an impressive >22%. We can also see a trend of declining leverage, especially for URI, a highly leveraged company coming out of the GFC to kick off its M&A spree over the last decade. Historically, valuation multiples have been similar for both companies but diverted for a few years during the pandemic in favor of Ashtead. Let’s look at a few differences between both company’s strategies.

🔒 This is where premium content would normally begin
If you enjoyed this free sample, consider subscribing to Heavy Moat Investments to get full access to all my deep dives, investment ideas, and exclusive insights.
As a premium subscriber, you’ll get:
✔ Detailed Research on high-quality global compounders, with deep fundamental & valuation analysis.
✔ Actionable Investment Pitches – Ideas with high upside potential and limited downside.
✔ Earnings Breakdowns on key reports and market reactions.
✔ Real-Time Trade Alerts on all my portfolio moves, plus access to the premium chat.
✔ Exclusive Investing Tools, including my Inverse DCF template and more.
Below is a comparison chart I made when I invested in Ashtead. Both companies are similar in size and are riding the lucrative wave of specialty rentals, which account for 30% of sales.
Key differences:
Ashtead has a lower construction exposure, making it less vulnerable to economic downturns.
URI does fewer M&A deals but generally acquires large competitors, like the $2b Ahern acquisition in 2022. Ashtead mainly makes bolt-on acquisitions but at a much higher frequency.
Due to the larger deal sizes, URI aims to be higher leveraged than Ashtead.
URI has been much more aggressive in buying back shares, down 33.7% versus 13.3% for Ashtead over the last ten years.
URI has a much better FCF conversion because of how they reinvest: Ashtead is much more active in organic greenfield expansion through CapEx, while URI mainly grows through M&A. This means investments are in the investing cash flow statement instead of the operating cash flow statement, making URI look much more profitable.
Both companies have good compensation schemes that focus on earnings growth and efficiencies (ROIC, working capital, equipment utilization, etc.). However, neither has significant insider ownership.

When I researched the companies, I really struggled to pick one, and sadly, I invested in Ashtead instead of URI. Below, you can see the performance since I bought Ashtead (the white vertical line indicates when I sold Ashtead). We can see that URI massively outperformed, while Ashtead severely underperformed the S&P 500. While Ashtead hasn’t performed as I expected fundamentally, with some slowdowns in growth and a worsening economic environment, the bulk of outperformance was multiple expansion. URI was trading at a >20% discount to Ashtead at the time (10.8x NTM EV/EBIT vs. 12.4x), while usually, both companies roughly trade in line. Today, both companies trade at 14x. I concluded that Ashtead has a better strategy and is a slightly better business than URI. Still, the valuation discount made URI a more attractive option, at least for the short to medium term. Ashtead has missed earnings for the last three quarters in a row (however, just slightly) and lowered its guidance while beating estimates, leading to the rerating.

Capital Efficiency
Let’s look at capital efficiencies. Operating cash flow grew at a 9% CAGR, while maintenance CapEx grew faster at 17%. NOPAT almost kept up with maintenance CapEx, but owner earnings fell behind at just 5% CAGR. Invested capital grew alongside NOPAT, and ROIC was stable on a NOPAT basis, averaging 12%. Overall, the business did not get more efficient as it scaled investments. This is also evident in its flat margins over the last decade.

Reinvestment into the business is large, driven by growth CapEx into new equipment and greenfield expansion alongside bolt-on M&A. Over the last five years, Ashtead reinvested $10.4 billion compared to $6.3 billion of NOPAT and $11.7 billion in owner earnings. Ashtead issued $2.2 billion in net debt to fund this. Dividends and share buybacks accounted for $3.2 billion. This means that Ashtead used more than its cashflows to reinvest into the business and return to shareholders. The company did not overlever, though, and earnings have increased. There is, however, a lack of operating leverage.

Ashteads’ slides show a similar story: EBITDA margin hasn’t improved since the increase from 42% to 45% in 2015. Its international diversification primarily drives this: The US business boasts 47% EBITDA margins, while Canada (40%) and the UK (28%) drag group-level margins down. We can see that cash conversion declined and that the business has become more capital-intensive. There has been a sharp increase in replacement/maintenance CapEx in recent years, from $617 million in 2019 to $2.1 billion in 2024. This trend is worrying and could impact cash conversion as we advance.

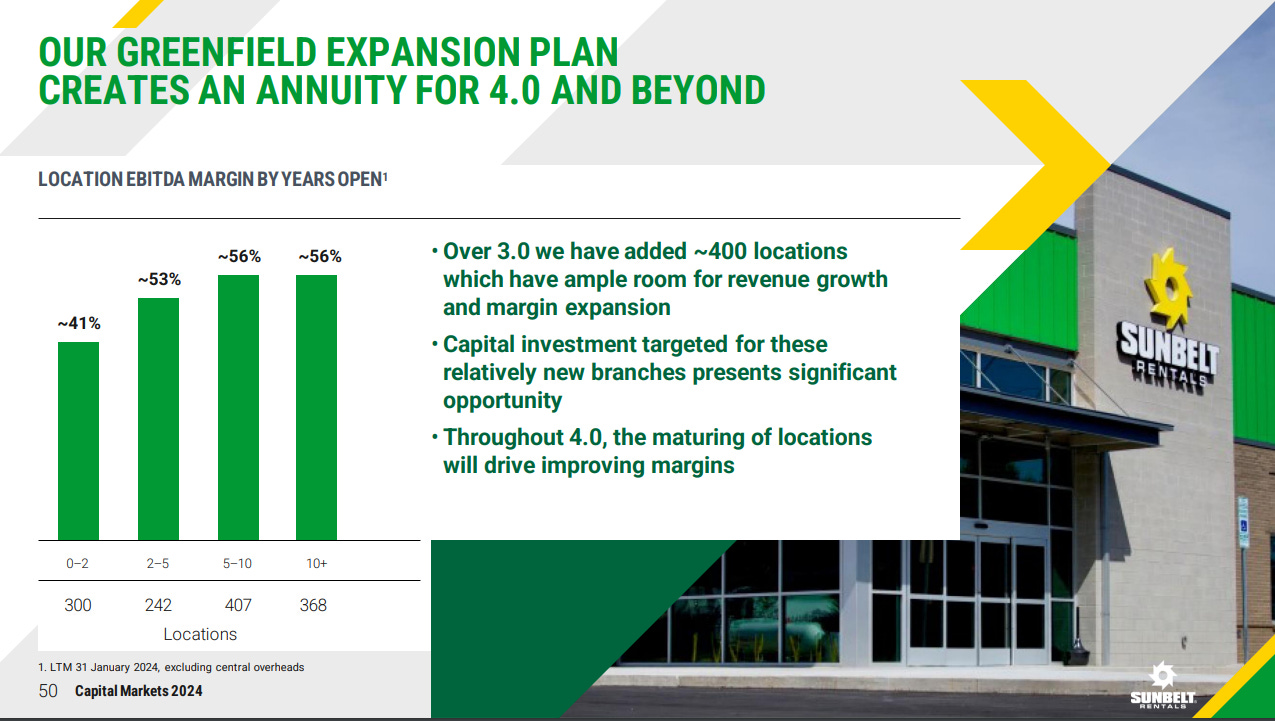
The US accounts for 85% of the business, Canada 6 and the UK 9%. These markets do not have the necessary scale of the US and likely won’t ever surpass them unless reinvestment stops. Below, you can see an illustration of the maturity level of Ashtead’s branches and the underlying margin. Profitability ramps rapidly in years 2-5 and then matures around 56%. Initially, branches need a lot of capex to build, stock and improve the locations. This means that Ashtead has operating leverage inherent in its business and should see rising margins as the company matures and location growth slows. EBITDA margins are expected to rise to the mid-50s in the US and 47-50% on a group level through Sunbelt 4.0 (its FY29 plan).
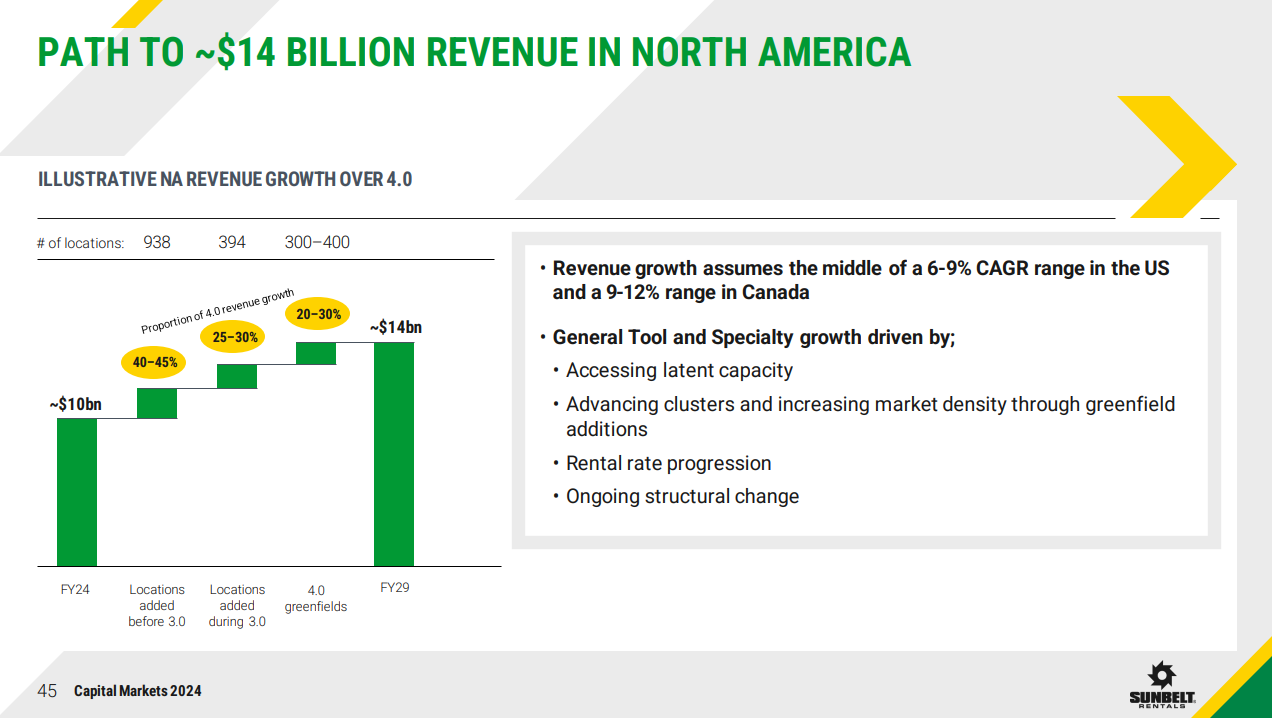
Overall, Ashtead has ample reinvestment runway through its organic location expansion plans, clustering and specialty segment growth. Ashtead expects new greenfield expansion to account for 20-30% of the growth, with the rest coming from existing locations. Overall, we see a strong deceleration of growth going forward. 6-9% revenue growth is far from the 20% CAGR averaged over the last decade. Management expects capital allocation in favor of bolt-ons would enhance EPS by 2% annually, and a buyback focus would enhance by 1%. These aren’t really impressive outlooks and point towards the deceleration of growth. Overall the investor day left me disappointed.
The Dodge construction index shows a similar picture: After strong growth from the pandemic's backlog, we return to usual growth rates close to GDP. This hopefully means a deceleration of Ashtead's investment requirements and rising profitability.

Valuation
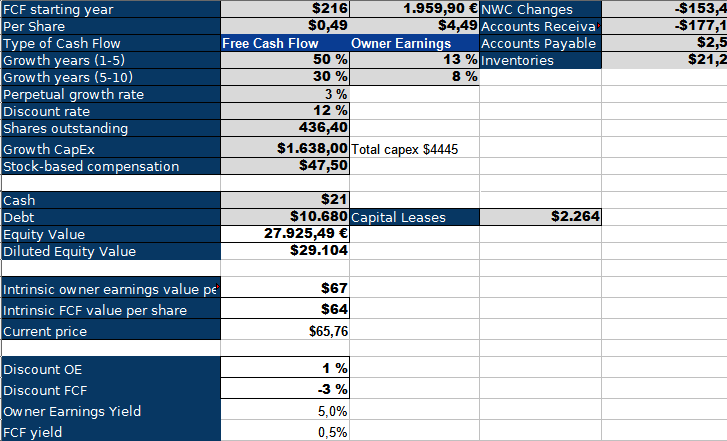
Let’s look at Ashtead’s valuation from three angles. First, let’s look at the inverse DCF. Given the large growth CapEx, we can see that the FCF lens is pointless. After adding back $1.638 billion in growth CapEx, we get a 5% owner earnings yield. To achieve a 12% return (given the construction exposure, I’m uncomfortable using a 10% discount rate), we need a 13% growth rate in the next five years, followed by five years of 8% growth. This seems far-fetched, given management’s plan to achieve 6-9% revenue growth and 10% EPS growth.
Let’s look at an IRR model next. We have a wide range of outcomes from no returns to 18%. The bull case sees 10% revenue growth (above investor day guidance), margin expansion within the expected range and a multiple expansion. The bear case sees revenue growth in line with expected construction starts, no margin expansion and multiple derating to its historical lower ranges.
Valuation multiples are currently all above 10-year averages, while growth is decelerating. This is a dangerous combination, and I wouldn’t bet on margin expansion, so we should be prepared for multiple pressures. Another interesting point in the chart below is the FCF yield. In 2020, this shot up to 5.5% after Ashtead pulled growth investments back and retained cash. This shows that they can gush cash but chose to reinvest over the last years.

Conclusion
Ashtead is an excellent business in a fragmented market with clear advantages and trends toward consolidation. Eventually, Ashtead and URI (and maybe a third player) will command 50% of the market versus <30% today. The business is, however, very capital intensive, and it seems like the intensity has increased in recent years, as measured by replacement capex versus earnings growth. As the COVID backlog is worked through and the equipment rentals market is expected to grow at GPD+, Ashtead will slow down its growth and investments. However, I do not see a margin of safety to satisfying returns here, and there is a risk of deterioration in the economic climate, directly impacting the rental market. The long-term trend, however, towards higher rental penetration (ESG, because of much higher utilization than ownership for small businesses and the trend towards capital-light business models) and consolidation support a long growth runway for Ashtead and United Rentals. While I sold out of Ashtead, I keep it on my watchlist.
Lessons learned from Ashtead
Ashtead showed me that I do not like businesses with this level of capital intensity. Furthermore, I didn’t put a large enough margin of safety in valuing a cyclical business. My initial valuation used a 10% discount rate, which is not enough for this level of cyclicality.